From the News Room
Time to update your subscription to Datum Workstation?
Please contact us if you would like a price quote for updating.
Official Release of Datum Workstation 18 January 2023
The official release of Datum Workstation, previously called TNTgis, is now available and can be downloaded here.
Please contact us or an Authorized Reseller if you would like a price quote for upgrading.
Datum Workstation Price Quotes December 2022
Price quotes were sent in mid December to all current and recent TNTgis customers about the upcoming release of Datum Workstation.
If you did not receive one, please contact us.
Official Release of TNTgis 2022 19 January 2022
The official release of TNTgis 2022 is now available.
Please contact MicroImages or an Authorized Reseller if you would like a price quote for upgrading to version 2022.
Here's a list of new features and enhancements in TNTgis 2022.
Official Release of TNTgis 2021 20 January 2021
The official release of TNTgis 2021 is now available.
Please contact MicroImages or an Authorized Reseller if you would like a price quote for upgrading to version 2021.
Here's a list of new features and enhancements in TNTgis 2021.
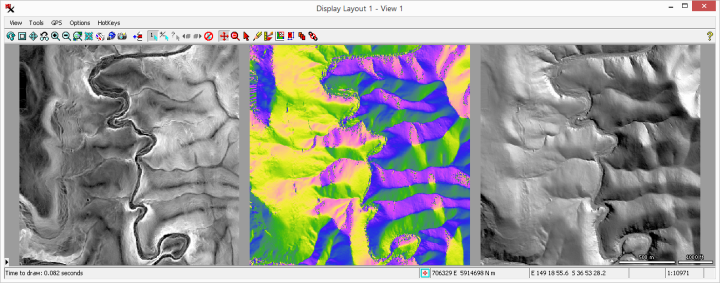
New Tutorial: Topographic Properties 17 September 2020
The Topographic Properties process computes rasters with fundamental topographic property values derived from an input Digital Elevation Model (DEM) raster.
Properties include: Slope, Aspect, Shading, Curvature, Laplacian of Gaussian, Topographic Position Index, Slope Position Class, Openness, Roughness, and Ruggedness Index.
The documentation for the Topographic Properties process includes an exercise with sample data you can use to try it out.
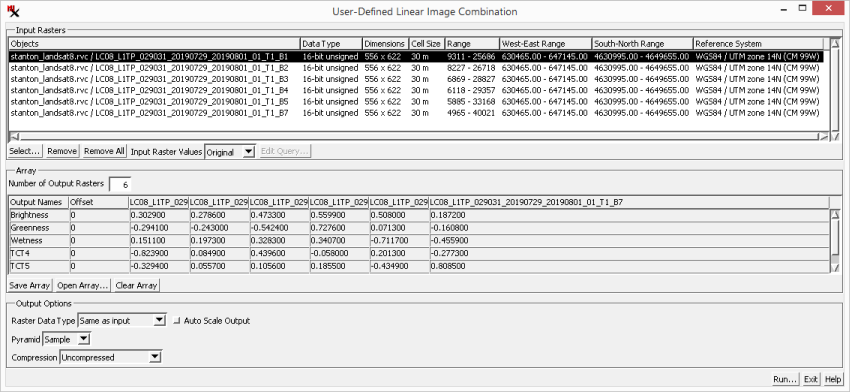
New Download: Raster Linear Combination Coefficients 11 August 2020
Satellite–specific coefficients are available now,
which can be loaded directly in the User–Defined Linear Image Combination process to more easily set up a tasseled cap transformation.
The tasseled cap transformation is used to create greenness, brightness, and wetness rasters from multispectral data.
The User–Defined Linear Image Combination process uses an array of coefficients to perform a linear combination operation on input image bands.
An .arr file can be used to more easily set up, modify, and reuse coefficients for your linear equations.
Supported Hardware: "Contour" 3D stereoscopic GIS display 15 July 2020
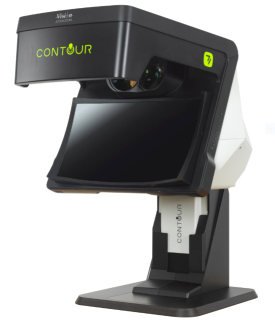
"Contour" is a glasses-free stereo presentation technology by Vision Engineering, it enables users to view subjects in stereoscopic 3D by projecting two independent
optical channels to the user's eyes so that each eye sees the subject from a slightly different angle, thus replicating our natural stereo vision and perception of depth.
Compatibility between "Contour" stereo display and TNTgis software has been tested and proven. To configure TNTgis software to interface with "Contour", set "Stereo Mode" to "OpenGL".
A comprehensive set of stereo configuration settings offered by TNTgis software allows the analyst to tune stereo presentation to achieve great depth perception and user comfort.
More information on "Contour" display can be found at Vision Engineering.
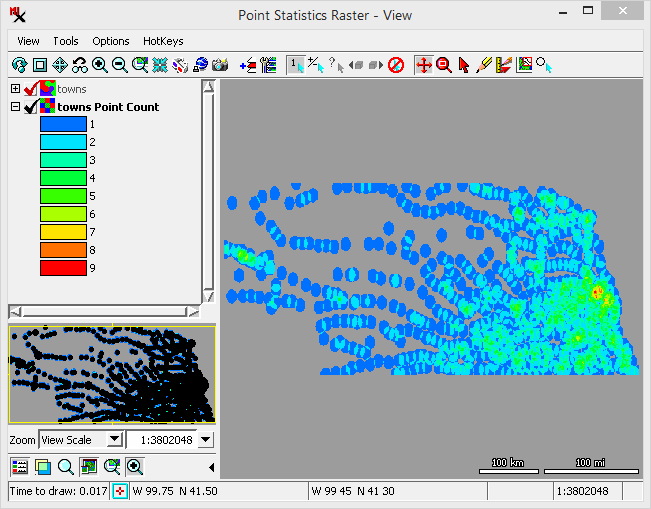
New Tutorial: Point Statistics Raster 8 July 2020
The Point Statistics Raster process creates a raster containing statistics from point data.
Statistics are accumulated from a collection of points by determining which points fall within each raster cell or a specified radius of the cell center.
The points may simply be counted to produce the cell value or density (points per unit area), or attribute fields can be specified to provide values to use in computing various statistics.
The new tutorial for the Point Statistics Raster process includes exercises
with sample data you can use to try it out.
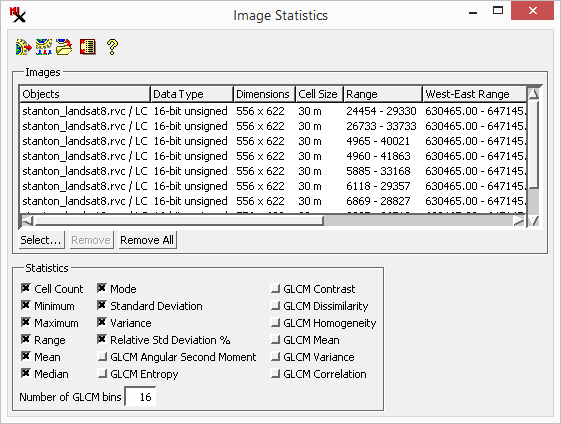
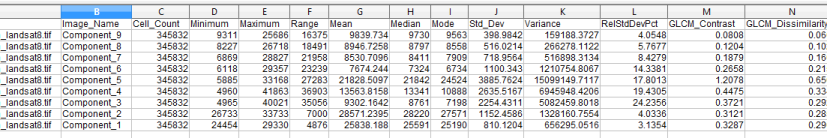
New Tutorial: Image Statistics 17 June 2020
The new Image Statistics process is available in the Development Version of TNTgis 2021 (Image > Statistics > Statistics by Band). It computes raster cell statistics from one or more selected images. You can choose to compute standard statistical values such as mean, median, and standard deviation, and also compute a number of Gray Level Co-occurrence Matrix statistics. The new tutorial for the Image Statistics process includes an exercise with sample data you can use to try it out.
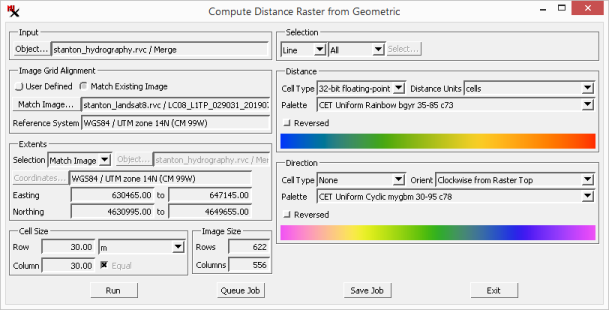
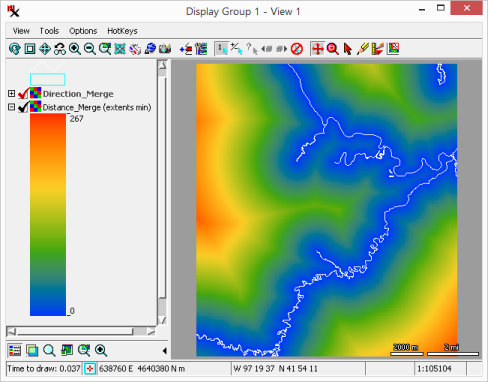
New Tutorial: Compute Distance Raster from Geometric 10 June 2020
This process creates a raster with cell values that represent the distance from (and/or direction to) geometric elements in the input. The new tutorial for the Compute Distance Raster from Geometric process includes an exercise with sample data you can use to try the process.
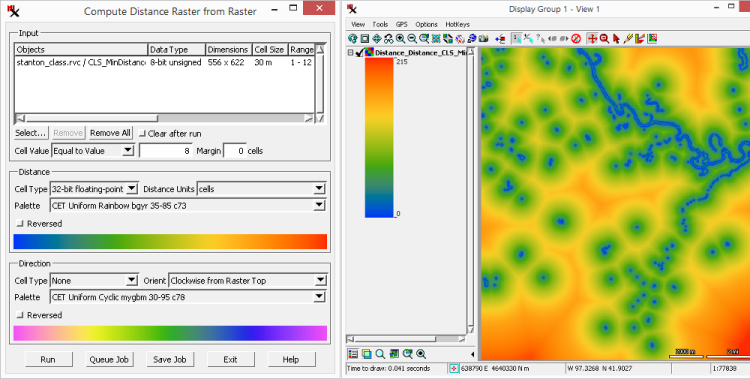
New Tutorial: Compute Distance Raster from Raster 20 May 2020
This process creates a raster with cell values that represent the distance from (and/or direction to) features of interest in the input raster. The new tutorial for the Compute Distance Raster from Raster process includes an exercise with sample data you can use to try the process.
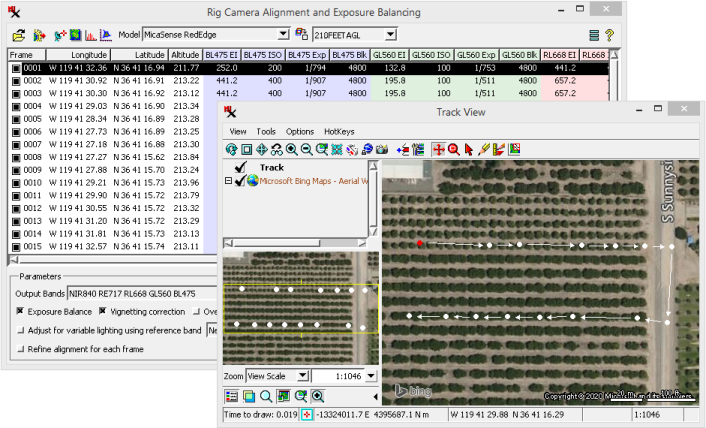
New Tutorial: Rig Camera Alignment & Exposure Balancing 13 May 2020
A multi-camera rig can acquire hundreds and thousands of image frames, each made up of multiple bands. This process performs multi-band alignment for each frame and exposure balancing from one frame to the next.
New tutorial for the Rig Camera Alignment & Exposure Balancing process includes five exercises with sample data you can use to try the process. An overview provides a brief introduction and additional sections give more in–depth information and can be used as a reference.
Remote Access to TNTgis 29 April 2020
In order to assist customers who are working from home, TNTgis 2020 will now allow remote operation via Windows Remote Desktop. This is now available in today's edition (29 April 2020).
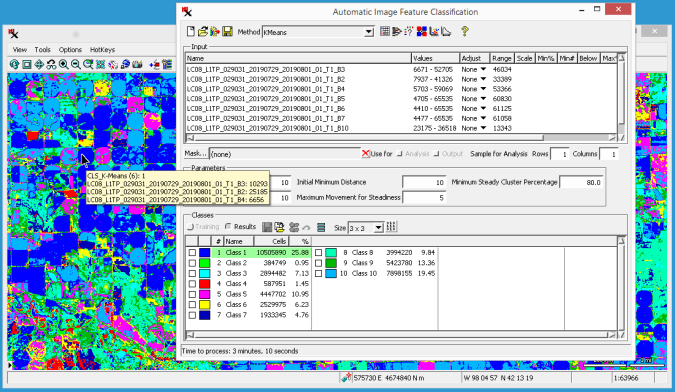
New Tutorial: Image Classification 28 April 2020
New tutorial for the Image Classification process includes 16 exercises with sample data you can use to try the process. An overview provides a brief introduction and additional sections give more in–depth information and can be used as a reference.
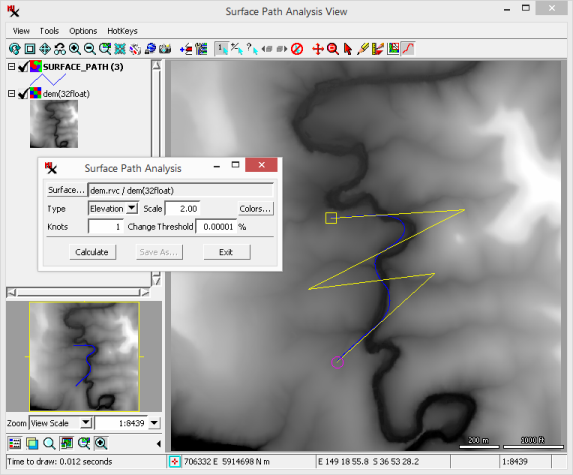
Surface Path Analysis Update — TNTmips 2020 27 April 2020
The Surface Path Analysis process finds a more direct route between two points along a surface or cost raster.
The process continuously loops to converge on the shortest path. It is designed for you to stop it at any time and still retain the line generated by the last iteration.
The process has been optimized to speed up processing. It also includes the ability to set a Change Threshold percentage,
so if the new path is not shorter than the previous path by the percentage specified, the processing will automatically stop.
A new tutorial includes a lesson with sample data you can use to try the process.
TNTgis 2021 Development Version 20 February 2020
TNTgis 2021 Development Version (DV) is now available to download. Weekly updates let you to try new features that are in development throughout the year for next year's release. All TNTmips 2020 professional licenses are automatically authorized to run the 2021 development version. Both the development and release versions can be installed at the same time and you can easily switch between versions.
TNTgis 2020 Official Release 22 January 2020
TNTgis 2020 is now the official Release Version. Download it and look at the new features and enhancements available in TNTgis 2020. Please contact us if you have any questions or would like to upgrade.
TNTgis 2020 New Feature List 10 December 2019
Here's a list of new features and enhancements in the upcoming release of TNTgis 2020.
TNTgis 2020 is scheduled for release on 22 January 2020. Price quotes for upgrading to version 2020 are currently being sent from MicroImages and our Authorized Resellers. Please contact us if you don't receive one or have any questions.