
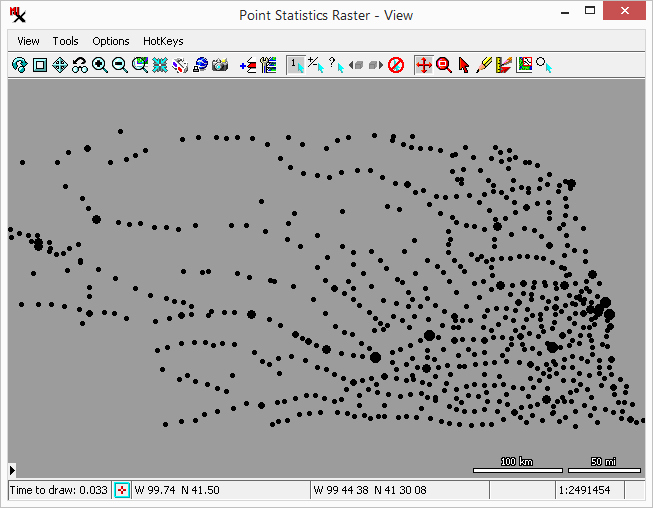
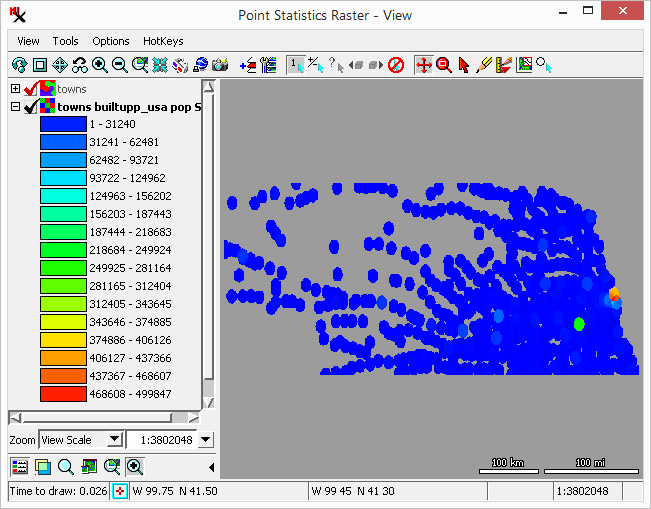
The process creates a raster with cell values reflecting the point count or point statistics within an area. Thus a point statistics raster provides a reflection of the distribution of point features. Point data that covers a wide area may appear nearly continuous and uniform. However, if these points represent some naturally occurring feature or phenomenon, rather than a regular sampling, there will be areas where the points are denser than others. Statistics are accumulated from a collection of points by determining which points fall within each raster cell or a specified radius of the cell center. The points may simply be counted to produce the cell value or density (points per unit area), or attribute fields can be specified to provide values to use in computing various statistics.
Prerequisite Skills: Getting Started and Displaying Geospatial Data.
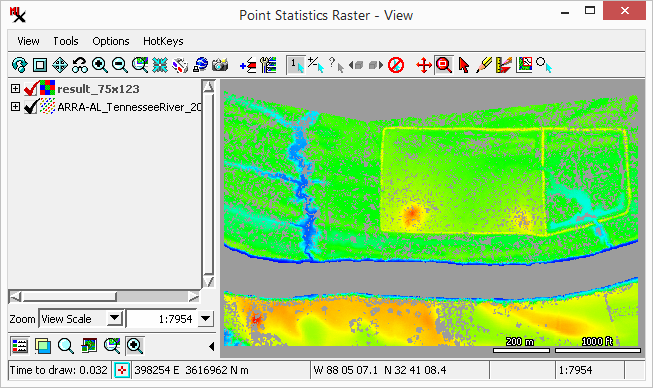
Sample Data: the nebraska_towns.rvc file in nebraska.zip and ARRA-AL_TennesseeRiver_2010_000002_ground.las in alabama.zip
Tutorial Lesson: The exercises below provide an introduction.
These lessons provide a quick introduction.
To run the process: load the input points, set output raster grid (image size), set method and run for or other output option.
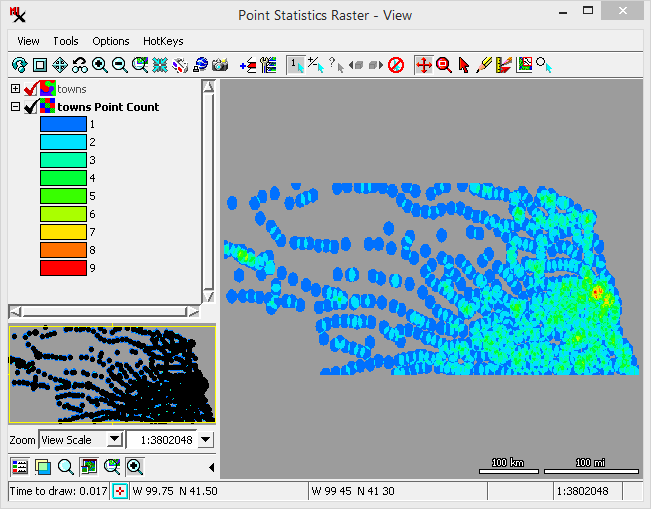
In this exercise, points are counted within the specified radius and used for the raster cell values. The by option can be useful when working with sparse points.
Leave the set to and .
Leave the and .
(continued from previous exercise)
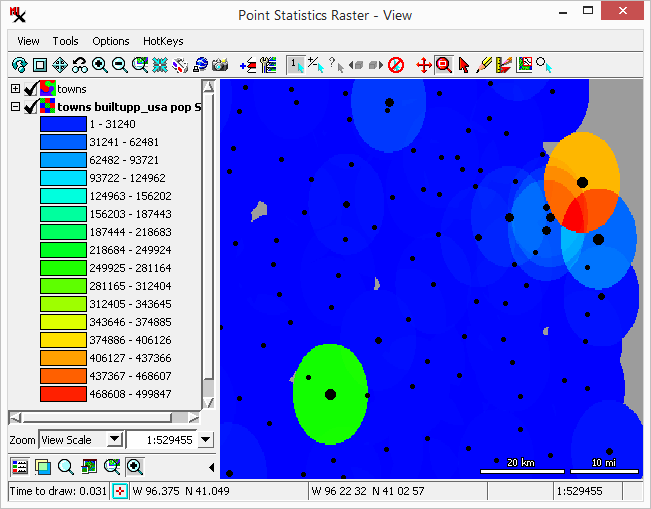
Instead of counting the points, compute statistics from attributes of points within specified radius.
Note, you can use the option to select the table and field. The 'pop' field contains the town populations.
Instead of gathering points within a radius, the option looks at points within the raster cell. The by option is useful when working with dense points.
The data provided for this exercise requires a TNTmips Pro license. If you don't have a professional license, use the nebraska_towns.rvc / towns vector with modified settings: set the cell size large enough to contain multiple points and select a numeric attribute such as population (builtupp_usa.pop).
The process takes point elements as input (from a vector, CAD, shape object, shapefile, or .las LiDAR file). You have the option to include all elements or limit them using a database query. The points within the output raster cell or specified radius can be counted. In addition, values in the point database can also be used to figure cell values.
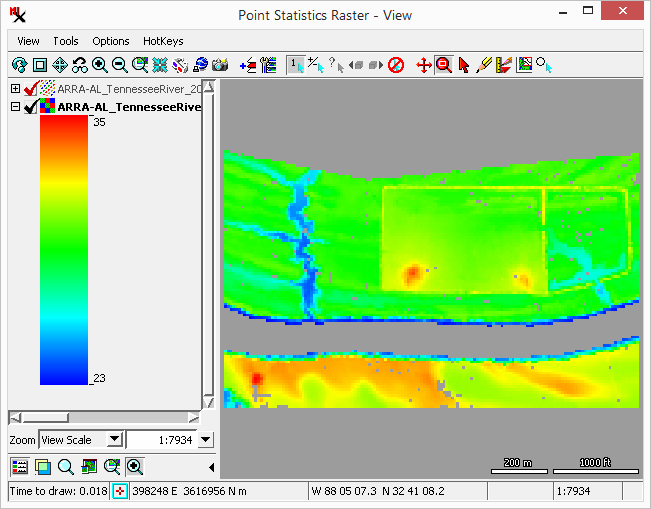
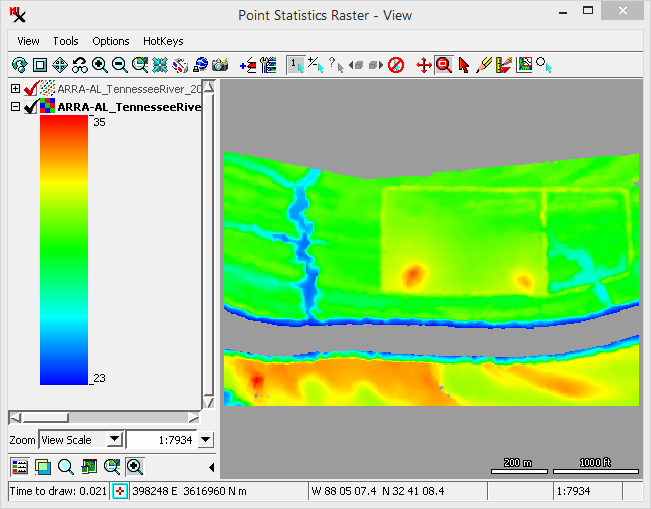
The process outputs different types of statistics rasters. The data type will be determined on the range of cell values. The process includes the option of setting a color palette that is used when displaying the result.
There are three general types of statistics rasters you can make: (point count), , or from .
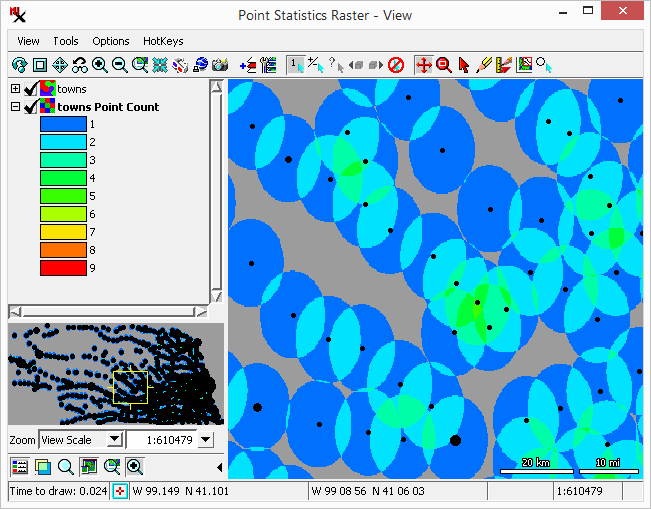
Set to to include each point in only the cell that contains it. In this case, every point will be counted exactly once, assuming no points fall outside the output raster extents. When is set to all points within the designated radius of the cell center are assigned to that cell. Generally this will result in points being counted for multiple cells. It is recommended that the radius be at least the distance from the cell center to the corner to avoid excluding points from being counted.
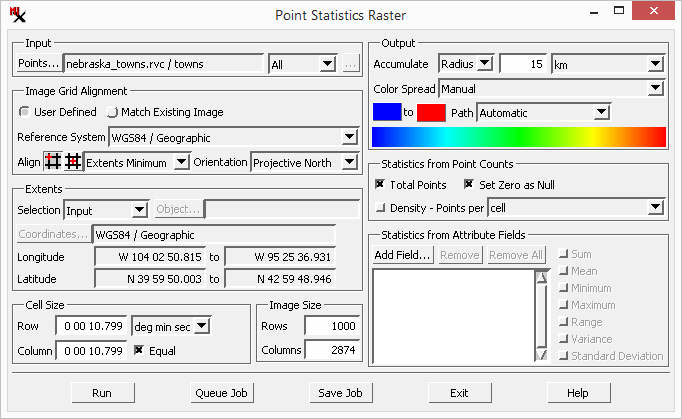
The window is used to run the process.
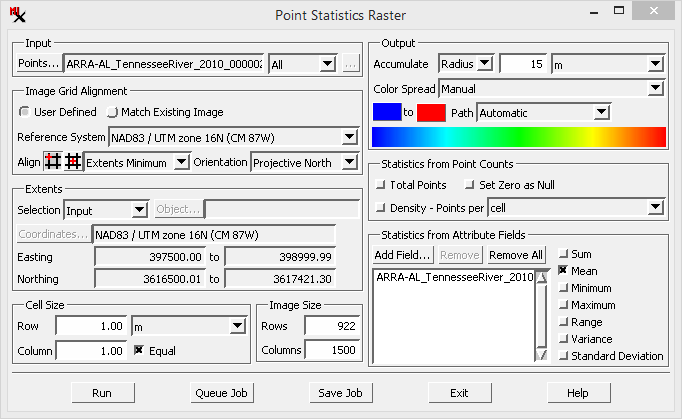
– Select a geometric object or shape file with point elements. Specify or limit the points of interest using the and options.
Specify the output raster's grid, extents, cell size, and image size using these four panes. For more information, see the Raster Grid Controls section.
– Specify the method used to count points, either by or . Then if using the option, enter the size of the radius.
– Menu to select method on how to create the output raster color palette: , or . The option gives you two color boxes to set the start and end colors, which is used with the option to create the colors: , and . The option opens the window. You also have the and options.
Note, if you choose the method, the colors are based on the cell value range and thus may be different from one input to another. However, if you choose a color palette, the colors are set based on the color order in the palette and will remain the same for the same values over different datasets.
– Point counted based on option: the number of points within the output or specified .
– Points per unit area.
Note that if is by and is , the and results will be equal.
For areas where no points occur, the toggle allows these cells to be "null" to indicate no data, and typically display as transparent. The actual output cell type will be determined automatically based on the maximum count occurring in the resulting raster.
– Select one or more field(s) to get numeric point attributes. Then, any or all of the available statistics can be computed: , and .
Note, the colors are always spread over the range of output values, regardless of whether a manual or predefined palette is used.