
The process computes raster cell statistics from one or more selected images. You can choose to compute standard statistical values such as mean, median, and standard deviation, and also compute a number of Gray Level Co-occurrence Matrix statistics.
Prerequisite Skills: Getting Started and Displaying Geospatial Data.
Sample Data: stanton_landsat8.rvc in stanton.zip
Tutorial Lesson: The exercise below provides an introduction.
To run the process: load the rasters, select the statistics you want, and run.
The process takes one or more grayscale, hyperspectral, or color composite images as input.
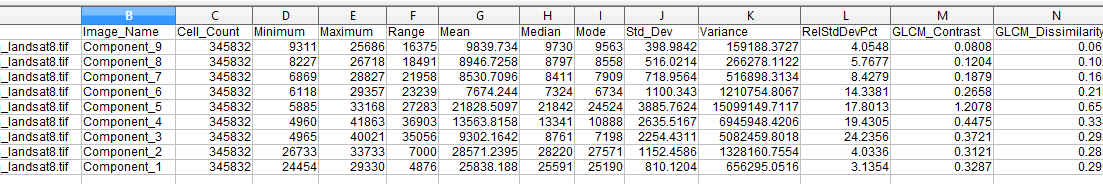
Statistics can be output to a .txt or .csv file. The process outputs a separate row of statistics for each color component or image band.
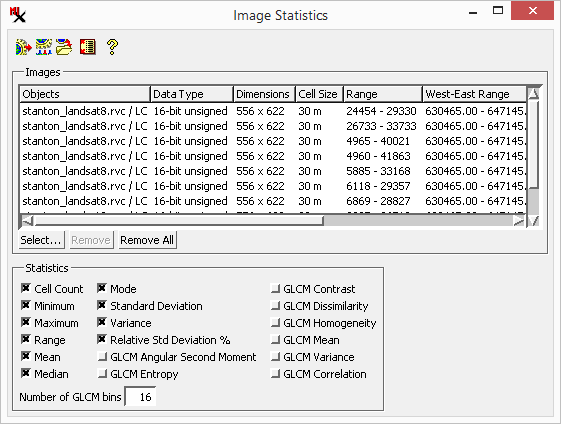
The window is used to run the process.
![]() – run the process after selecting the desired statistics.
– run the process after selecting the desired statistics.
![]() /
/ ![]() – standard Queue Job and Save Job icon buttons allow you to execute the process using the TNTgis Job Processing system. See Job Processing for documentation.
– standard Queue Job and Save Job icon buttons allow you to execute the process using the TNTgis Job Processing system. See Job Processing for documentation.
![]() – turn off the option to replace spaces with the underscore character.
– turn off the option to replace spaces with the underscore character.
![]() – process documentation.
– process documentation.
This section lets you select the input and shows it in a raster input list.
– choose one or more images from which to compute the statistics. You can choose grayscale, hyperspectral, or color composite images.
– remove selected or all images from list.
The Statistics box lists the measures available for the selected element type with a checkbox allowing you to select or deselect each. The options include:
and standard statistical measures: , and .
– Is a dimensionless value computed by dividing the standard deviation by the mean and multiplying by 100 to express the value as percentage. This value is generally only meaningful when all cell values are positive.
– A number of Gray Level Co-occurrence Matrix (GLCM) texture measures are available. These measures first quantize the range of image cell values into bins using the value in the field (range 16 to 64). A co-occurrence matrix is computed to record how often specific pairs of bin values occur in immediately neighboring cell positions (horizontally and vertically).
Each GLCM option derives a different statistical texture measure from that matrix. For details of the individual GLCM measures, see the Technical Guide entitled Raster and Image Processing: Gray Level Co-occurrence Matrix Filters.