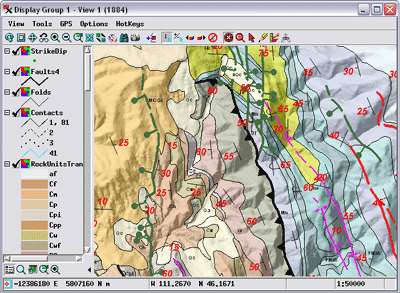
Complex map display with sidebar legends
The powerful Display capabilities in the TNTgis software gives you a multitude of ways to explore and visualize your geospatial data. TNTmips, TNTedit, and TNTatlas allow you to view imagery, map data, and terrain data in almost any form, including dozens of file types in their native format. You can overlay any number of geodata layers of different types, open multiple geolocked views, and even add terrain data to create 3D perspective and stereoscopic renderings. Powerful tools are provided for visualizing and enhancing multispectral and hyperspectral images, designing display styles for map data, making measurements, using interactive queries to explore map attributes, and composing map layouts for printing.
See also:
Tech Guides on Visualization and the
Displaying Geodata tutorial.
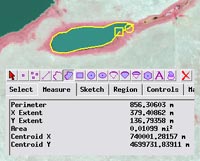
Sketching and measuring tools
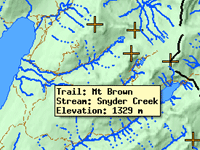
DataTips show attribute information
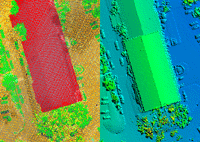
View LIDAR data as points or as virtual terrain surface
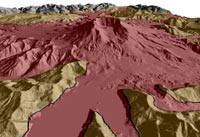
3D perspective views
Viewing Geodata Highlights:
- Overlay any number/type of geodata layer: raster, vector, shape, CAD, TIN, database pin map, terrain, web tileset, Web Map Service, ArcIMS
- Include layers in a wide variety of formats without importing (e.g., JP2, GeoTIFF, MrSID, shapefile, DGN, geodatabase)
- Overlay layers in different coordinate reference systems with automatic reprojection to match the target reference system
- Use multiple views geolocked by scale, position, or both
- Use terrain data to create 3D perspective and stereoscopic views of image and map layers
- Pop-in DataTips reveal specified attributes for map elements / image cells
- Open database tables to view full set of map element attributes and select elements and records manually or by query
- View window sidebar provides layer controls, legends, locator, zoom controls, and others
- Use View-in-View tool to compare sets of layers within a single view
- GeoToolbox provides multi-purpose drawing tools for measuring, sketching and annotation, and creating region objects for data processing
- Stored pyramid tiers for images provide fast display at any scale
- Set visibility of map element classes by scale to provide map detail commensurate with the current view scale
- Set transparency for raster and geometric layers to provide visibility for underlying layers
- Enhance contrast and adjust color of image using full image or designated area and use on-the-fly image filtering to sharpen, smooth, and detect edges
- Automatically generate display styles for map element classes, design individual styles, or create custom styles using scripts
- View LIDAR data as points styled by class/elevation/return type or as virtual terrain surface
- Design map layouts with legends, scale bars, map grids, and text and print or render to PDF