DEM-Orthophoto Features in TNT products V5.6
V5.60 –– April 1997
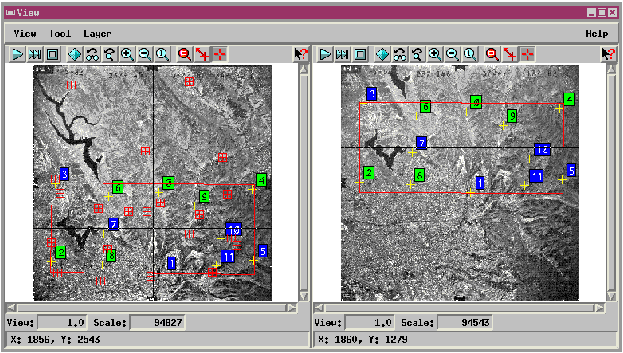 |
| Red boxed tick marks are georeference points. Yellow tick marks are correlation points. Colored labels indicate the strength of the image correlation for each tie point. The area being modeled is inscribed with a red box. |
 A
new easy-to-use interface facilitates placing correlation points in the
Relative Orientation step (step A) for DEM extraction and orthoimage creation.
Twin canvases in a View window show correlation points, georeference points,
the area being modeled, and the correlation point crosshair.
A
new easy-to-use interface facilitates placing correlation points in the
Relative Orientation step (step A) for DEM extraction and orthoimage creation.
Twin canvases in a View window show correlation points, georeference points,
the area being modeled, and the correlation point crosshair.
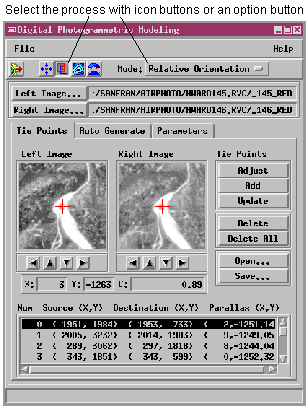
The associated Digital Photogrammetric Modeling window presents a selection of process control features. Icon buttons at the top of the window select the current processing step. Tabbed sections present features associated with each process.
The Tie Points tab for Relative Orientation presents a zoomed view of the current tie point position in each image. The Tie Point is originally placed in one of the View window's two canvases, and then evaluated and adjusted in the zoomed Tie Points tab view. You can nudge the position of the tie point with arrow buttons and then click the Adjust push button to apply a best-fit statistical match to move the crosshairs.
The Parameters tab for Relative Orientation lets you choose style and display options for correlation point labels, georeference tick marks, the model area box, and the zoom level of the Tie Points tab view.