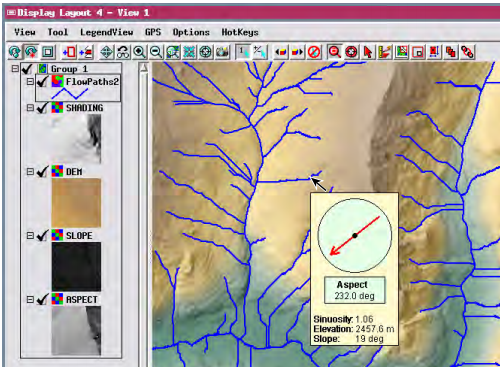
Display Control scripts let you add custom text and rich, context-sensitive graphical information shown as DataTips in groups, layouts, and atlases. A control script can read values from the raster cells and geometric elements at the cursor location, perform calculations, and create charts, graphs, or other specialized graphics for presentation in the DataTip. You can configure the script to use the graphic alone (with transparent background) or embed the graphic in the default rectangular DataTip with background color and border. The script can also either allow or suppress the DataTip information that has been set outside the script for the various layers in the view.
Display Control scripts are created via the Display Manager's Display > Edit Control Script menu option.
See also:
Interactive Windows, another type of Display Control script.
Computed Fields to see how to create string expression fields to use with multi-line DataTips.