Online Maps — Geometric Web Tilesets

TNTmips can convert styled thematic map layers to geometric web tilesets, which contain map data in tiled vector graphic form and which can include attribute information for the map elements. The map attributes can be shown in legend form in the geomashup and can be viewed for individual map elements in popup information balloons in the geoviewer. Geometric tilesets allow web presentation of and user interaction with information-rich map data for any size area over multiple map scales.
TNTmips can create geometric web tilesets containing SVG, compressed SVG (SVGZ), or KML tile files in the Export Geometric Tileset process. Line and polygon elements in the source data are automatically simplified for rendering at successively lower zoom levels, reducing the complexity and stored size of the lower-resolution tiles for efficient fast display in the browser. All geometric tileset forms can be used to present map data with styled polygon, line, and point features as well as labels. Geometric web tilesets can be used in geomashups for Google Maps, Open Layers and Google Earth (KML only) geoviewers. For more information see Comparing SVG & KML Geometric Tilesets.
Click icons below map to open geomashups with:
Townsend Montana Geologic Map
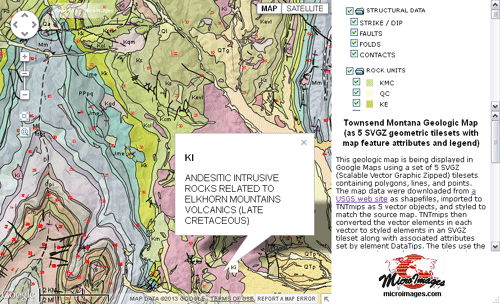
This geologic map uses a set of 5 geometric web tilesets containing polygons, lines, and points with their associated map attributes. Hovering the mouse over a map feature reveals the feature type, and left-clicking on the map pops in a balloon with the name and description of the feature type. A legend created dynamically for from these attributes for the Rock Units layer is shown in the sidebar. Examples of SVG, SVGZ, and KML geometric tilesets are shown.
The TNTmips interactive Geomashup process was used to assemble the 5 tilesets, sidebar with legend, and other features into these mashups. Structural features (contacts, faults, folds, and strike/dip measurements) are organized in the layer controls as a separate layer group so that this entire group or its individual layers can be turned on or off as desired. The Rock Units layer is shown with partial transparency to allow features from the base map/image to show through for reference.
The source map data were downloaded from a USGS web site as shapefiles, imported to TNTmips as 5 vector objects, and styled to match the source map. The Export Geometric Tileset process in TNTmips then converted the vector elements in each vector to styled elements in a geometric tileset along with associated attributes set by element DataTips. Since the map layers are tilesets, the map could cover any geographic extents with the same level of detail and performance in your web browser.
Nebraska Groundwater Data
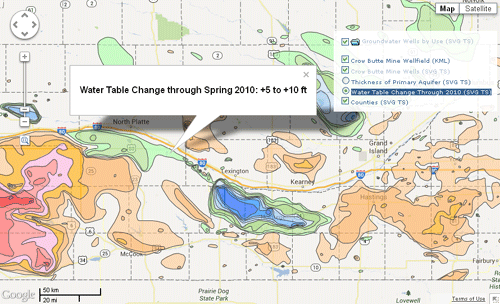
Several types of data on groundwater and its use in Nebraska are presented in these geomashups using geometric tilesets created in TNTmips. Zoom in anywhere to see more map detail and the location, use, and characteristics of over 169,000 registered wells in this state. Examples of SVG, SVGZ, and KML tilesets are shown. A geometric tileset stores the points, lines, and polygons making up a map layer in a sequence of small tiled KML or SVG(Z) files that can be fetched and rendered efficiently in the browser. By using a geometric tileset instead of a single KML or SVG file, any size area can be covered and rendered over a wide range of zoom levels, with rendering times independent of the size of the area.
The initial view in each geomashup displays a polygon tileset showing the amount of rise or fall in the level of the groundwater table (positive or negative change) in different areas from predevelopment through the Spring of 2010. The amount of change in each area is shown automatically as you move the mouse over the map; you can also left-click in any of the polygons to show the same information in an information window. This water table change layer is in a mutually-exclusive group controlled by radio buttons. The other layer in this group is a polygon tileset showing spatial variations in the thickness of the primary groundwater aquifer across Nebraska.
When you zoom in far enough, a point tileset showing groundwater well locations becomes visible. The information window shows a listing of selected data for each well. Well symbols are colored by the type of water use, and a legend listing these symbols and their explanation is shown in the layer controls. The Assemble Geomashup process in TNTmips, which was used to assemble these layers, lets you choose to create a legend for any individual KML or SVG(Z) tileset layer. A legend entry is created for each unique style and corresponding attribute value in the geometric tileset.
The bottom layer in this geomashup is a reference layer showing Nebraska county boundaries and county names; this layer is an SVG tileset of these geometric features.
Lancaster County Bike Routes and Trails
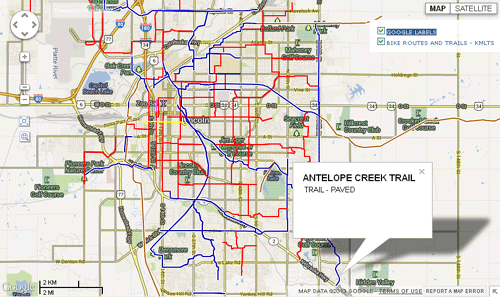
These geomashups show bicycle trails and on-street bicycle routes for Lancaster County, Nebraska. The lines and their attributes are provided by a KML geometric tileset created from a TNTgis vector object. Hovering the mouse over a line reveals a DataTip showing the trail or street name. Left-clicking on a line pops in an information balloon that also identifies the trail or route type, which is also indicated by the differing line styles. An option has been set to automatically close a previous info balloon when a new balloon opens.
A single KML file rendered from the TNTgis vector object would be too complex to render in the browser. Instead the styled vector lines were rendered into a KML geometric tileset using the Export Geometric Tileset process in TNTmips. This geometric tileset is a Google super-overlay structure made up of tiled sets of KML files depicting the bike trail/route lines at each zoom level. Only a few of the KML tile files are fetched by these geoviewers for any area and zoom level that you view. Geometric tilesets can thus be used to cover even larger areas than the single county shown here. The DataTip information attached to each TNTgis vector line was written into the KML tile files for presentation in the information balloons in these geomashups.