From the News Room
TNTgis 2019 New Feature List 5 December 2018
Here's a list of new features and enhancements in the upcoming release of TNTgis 2019.
TNTgis 2019 is scheduled for release on 16 January 2019. Price quotes for upgrading to version 2019 are currently being sent from MicroImages and our Authorized Resellers. Please contact us if you don't receive one or have any questions.
Release of TNTgis 2018 17 January 2018
The 2018 Release Version of the TNTgis software family (TNTmips, TNTedit, and TNTview) is now available.
New Features
Download the new Release Version today!
Rig Camera Alignment & Exposure Balancing — TNTmips Pro 2018 2 January 2017
Automatic multi-band alignment and exposure balancing is available for imagery taken with a multi-camera rig system.
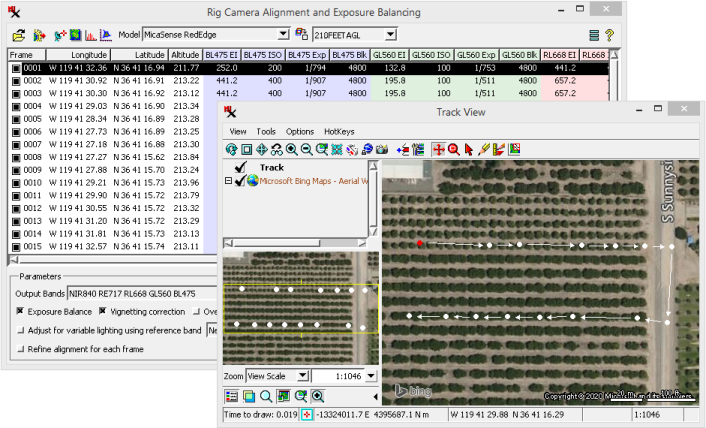
The Rig Camera Alignment & Exposure Balancing process
Try it now with the sample data provided here:
New Feature List 18 December 2017
Here's a list of new features and enhancements currently available in the Development Version of TNTgis 2018.
TNTgis 2018 is scheduled for release on 17 January 2018. If you are interested in upgrading to version 2018 and have not already received a price quote from MicroImages or one of our Authorized Resellers please contact us and one will be sent to you.
Load up to 32 Rasters in Image Band Correlation — TNTmips Pro 2018 15 Nov 2017
The number of input bands is limited by the number of graphs you can reasonable display in one window. If you select 32 input rasters it results in 496 correlation scatterplots. While displaying so many graphs at once means they will be small, depending on the window size you can still see the general shape of each scatterplot. The standard tools can also help you get the details and information you want:
- Use cursor tracking in the View to highlight corresponding raster cell values in each plot
- Place cursor over a point in one of the plots and zoom in - all plots will zoom in
- Place cursor over the graph data to see raster names, cell values, and cell counts
- Use Line tool as usual to get equation of the line
- The Highlight within Range tool can be used but it is more difficult with small graphs
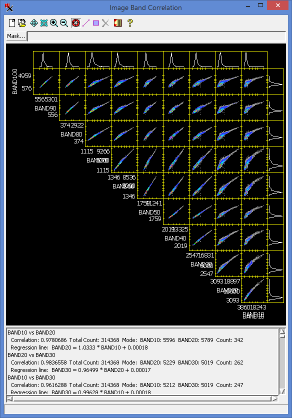
45 scatterplots showing correlation information for 10 image bands.
Overview: the Image Band Correlation window shows a scatterplot for all possible pairings of input bands from different sensors and/or dates. Raster cell values from both bands are plotted. The scatterplot thereby accentuates the cell value pairs that most often occur together in the two images. This window is commonly opened via a raster's right-mouse-button menu in the Display Manager, which prompts you to select the input rasters.
Tip: open the Image Band Correlation window via the icon in the Progressive Transformation process to automatically load up to 32 input rasters. This process also lets you display and compare all the histograms at once.
Georeference - Datum Transformation Supplemental Files 23 Oct 2017
A number of grid-based datum transformations have been added and are available via a supplemental installer. The Supplemental Datum Transformations installation contains grid shift files (.gsb), which contain information for a datum transformation – for instance between a local datum and WGS84. Grid shift files may be provided by a government or business and may be open source, private, or available for purchase. If you have open source .gsb files for your area of interest, we can add them to the supplemental installation.
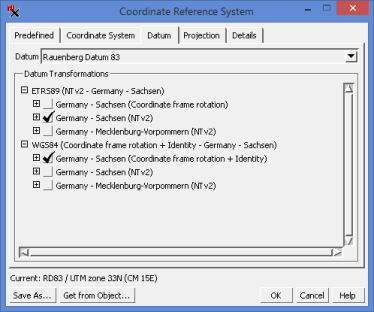
The NTv2 transformations between Rauenberg Datum 83
and ETRS89 are provided via supplemental .gsb files.
Note, there is no need to download and install the supplemental grid transformations unless you need them. All transformations for supported datums are listed for selection in the Datum tab of the Coordinate Reference System window including supplemental transformations. If you select a transformation that is available but not installed, a message will appear indicating where to download the optional transformation files.
Raster Thresholding - Otsu's Method for Raster Binarization — TNTmips Pro 2018 6 Sept 2017
Otsu's method automatically computes the optimum global threshold using the raster histogram. It is meant to be used on bimodal images (i.e. having two histogram peaks). The optimum threshold value is dependent on peak separation, noise, size of objects and background, as well as illumination and reflectance uniformity. The threshold value from Otsu's method is often better than a manual estimate found from looking at the histogram.

Raster Thresholding (Image > Convert Raster > Thresholding) - Results using Otsu's method.
Tip: open Preview and View windows by selecting the image name in the raster list.
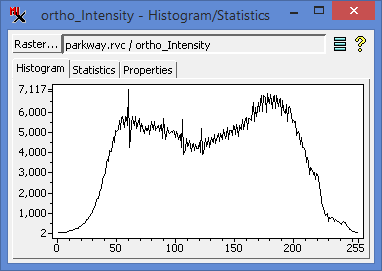
Bimodal histogram for above input raster with shallow valley
between peaks.
Images with distinct foreground objects and
background are likely to have a more distinct valley.
Create Custom Icons for TNTsdk-Based Applications — TNTmips Pro 2018 18 Aug 2017
The Edit TNTsdk Developer Icons process (Tools > Developer > Edit TNTsdk Developer Icons) lets you design your own icons and buttons for the user interface controls in your custom TNTsdk applications.
The Bitmap Symbol Editor opens when you Add or Edit icons in your icon file. When adding new icons you can start with an existing symbol pattern and edit it or create your own from scratch. The icons you add are referenced by your program in the same way as those provided by MicroImages.
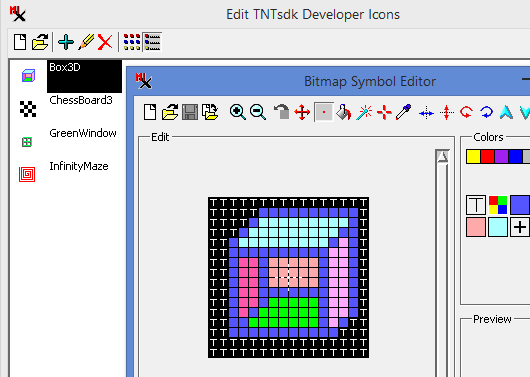
Edit TNTsdk Developer Icons
Populate Lookup Table in Reassign Cell Values — TNTmips Pro 2018 4 Aug 2017
The Reassign Image Cell Values process (Image > Classify > Reassign Image Cell Values) uses a lookup table that maps what output value a raster cell gets based on its input value. While each lookup operation can be entered manually, it does take some time.
Instead, you can quickly and easily create a lookup table with the Populate Lookup Table icon  . After selecting your input raster(s), simply click the Populate Lookup Table icon and specify either Input Interval or Number of Intervals. If desired, manually edit the table to fine tune any lookup operation.
The Populate Lookup Table feature works with all methods that use a lookup table — Reassign by: Value (one output per input value), Threshold (Minimum value defined, maximum derived from next rule), and Range (both Minimum and Maximum defined).
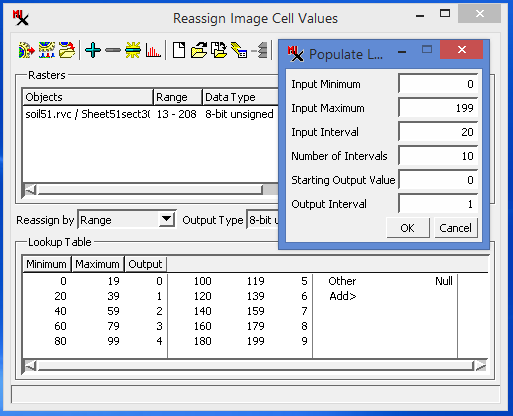
Reassign by Range using Populate Lookup Table Icon
Auto-raise Layer in View Window - TNTmips Pro 2018 21 July 2017
The Legend in the View window sidebar gives you a way to temporarily display a layer above all the other layers in the View.
Often when working with multiple layers in one View you want to look at a layer positioned underneath another. It can be cumbersome to raise and lower the layer of interest or repeatedly turn on and off the Show/Hide layer toggles.
Instead, hover your mouse over any layer name in the sidebar Legend. You will see a datatip near your cursor showing file path and description. At the same time the View window changes to show that layer on top. Any transparency for that layer is also temporarily turned off. When you move the mouse away from the layer name the View returns to normal.
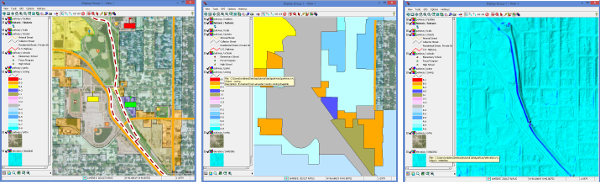
Normal display — Polygon layer brought to top — Shading raster on top
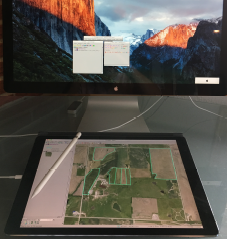
TNTmips' Spatial Data Editor:
Digitizing on an iPad Pro
Editor - Use iPad Pro as a Digitizer 28 June 2017
A useful App called duet lets you extend your computer's desktop to an iPad Pro giving you a way to digitize in the Spatial Data Editor using an iPad and the Apple Pencil.
To set up the duet App, purchase (US$19.99) and install it on an iPad Pro and then download and install a free copy of duet on your Mac or PC. Start duet on your computer, connect to your iPad with a USB cable (the one used for charging the iPad), and duet will automatically detect the iPad. See https://help.duetdisplay.com/getting-started for detailed installation instructions include how to adjust your display settings.
After setting up duet, you are ready to digitize in the Editor with your iPad. Simply drag the Editor's View window to the iPad and use the Pencil to directly trace or edit layers on the iPad's screen.
For best results, it is recommended that the system does not "sleep" while the connection is active.
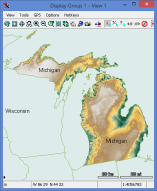
Polygons for the state of Michigan are combined to extract one raster for the state.
Raster Extract — Combine Polygons by Attribute 31 March 2017
The Raster Extract process now has a 'Combine by Attribute' toggle for the 'By Polygons' mode. This gives you the ability to treat multiple polygons with identical attributes as one region resulting in one output raster for each unique attribute. With the toggle off, separate rasters are created for each polygon.
All elements with blank or no attribute assigned will be combined as a single region. Attributes are matched by string value not by record, so different records sharing the same attribute value will be combined to form one region.
Welcome Geocomp International! 16 February 2017
MicroImages would like to welcome Geocomp International of Australia as an authorized Reseller of TNTgis software. Geocomp International is an inovative spatial data acquisition and consulting company that supplies specialized services to a range of industries requiring up to date spatial solutions for their projects.

Release of TNTgis 2017 26 January 2017
The 2017 Release Version of the TNTgis software family (TNTmips, TNTedit, and TNTview) is now available.
New Features
Download the new Release Version today!
New Feature List 7 December 2016
Here's a list of new features and enhancements currently available in the Development Version of TNTgis 2017.
TNTgis 2017 is scheduled for release on 18 January 2017. If you are interested in upgrading to version 2017 and have not already received a price quote from MicroImages or one of our Authorized Resellers please contact us and one will be sent to you.
Welcome Exa! 16 February 2017
MicroImages would like to welcome Exa Ltda. (formerly GeoMine) of Chile as an authorized Reseller of TNTgis software. Exa is a consulting services company with a team of specialists and experts who have extensive experience in the mining business at all stages.
GISGeography.com lists 1000 GIS Applications 16 June 2016
What can GIS really do? Take a look at the article on the GIS Geography web site to learn about 1000 GIS Applications in over 50 industries. TNTgis software is featured for uses in agriculture, transportation networks and LiDAR processing.
Moving to the Cloud! 23 February 2016
MicroImages' web site and services are moving to the cloud! Some web services may not be available until the transition is complete. We apologize for any inconvenience this may cause you.

Radiometric Correction of Satellite Images 21 January 2016
The Radiometric Correction process in TNTmips (Image / Radiometric Correction) calibrates images acquired by satellite optical sensors to radiance or reflectance values. These corrections allow more accurate assessment of ground surface properties and facilitate comparison between images acquired at different times or for different areas.
Release of TNTgis 2016 13 January 2016
The 2016 Release Version of the TNTgis software family (TNTmips, TNTedit, and TNTview) is now available.
This release includes new processes, updated processes, and many new features.
New Feature Highlights
Download the new Release Version today!
Automatic Image Georeferencing 6 January 2016
The Auto-Register operation in the Georeference process (TNTmips and TNTedit) can now automatically georeference geolocated aerial images with unknown orientations using a reference image. Geolocated images have map coordinates for only a single point (such as a GPS camera position recorded in EXIF metadata, nominally the image center). The Automatic method in Auto-Register uses keypoint matching to establish the image orientation relative to the reference (if necessary), then uses image cross-correlation to find additional control points. A new separate process to perform auto-registration on large sets of aerial images is also now available (Image / Auto-Register to Reference Image).
Auto-Register to Reference Image
Keypoint Matching for Image Registration
Batch Automatic Image Georeferencing
Spatial Display: Vector and Shape Layer Controls 16 December 2015
Layer controls dialogs provide access to display settings for specific types of layers. Open the Vector Layer Controls window by left-clicking
on the vector layer's icon button in the Display Manager or by right-clicking on the
layer name and choosing Controls from the popup menu. Shape Layer Controls are opened the same way for shape layers.
The layer controls are organized in a set of tabbed panels. The Object panel
provides settings that pertain to the entire layer. A tabbed panel for each of the vector element types: Points, Lines, Polygons, Nodes, and
Labels in Vector Layer Controls lets you set element specific controls to show and style elements, set datatips and dynamic labels, and label legend samples. The Shape Layer Controls dialog has an Elements tabbed panel with similar controls.
Spatial Display: Render to PDF 9 December 2015
The Render to PDF operation in TNTmips and TNTedit allows you to render the contents of the View window to a PDF file. The operation can render layers in simple groups or complex map layouts, including raster and geometric layers, WMS and ArcIMS layers, map grids, legends and scale bars, and text. Complex line and point symbols, including those created by CartoScripts, can be reproduced faithfully in the PDF file. Georeference information is automatically transferred, producing a Geospatial PDF file that can be used with the analysis tools in Adobe Reader to get coordinate readouts and make measurements. You also have the option to include layer controls in the PDF file so that any individual layer can be turned on or off in Adobe Reader. To use the Render to PDF operation, choose Display / Render to / PDF from the Display Manager.

UPDATED DataTip Technical Guides 3 December 2015
DataTips are provided in TNTgis to show selected attribute information for spatial layers under or near the screen cursor when it is paused in the View window. DataTips can show the cell value from a raster layer, database attributes for elements in geometric objects (vector, CAD, shape, Lidar, and TIN) and database pinmaps, and image thumbnails from a geotagged image database table. When you are displaying geometric data layers, you can choose to have the associated elements automatically highlighted in color when the DataTip is shown.
Spatial Display: Vector and Shape Layer Controls 16 December 2015
Layer controls dialogs provide access to display settings for specific types of layers. Open the Vector Layer Controls window by left-clicking
on the vector layer's icon button in the Display Manager or by right-clicking on the
layer name and choosing Controls from the popup menu. Shape Layer Controls are opened the same way for shape layers.
The layer controls are organized in a set of tabbed panels. The Object panel
provides settings that pertain to the entire layer. A tabbed panel for each of the vector element types: Points, Lines, Polygons, Nodes, and
Labels in Vector Layer Controls lets you set element specific controls to show and style elements, set datatips and dynamic labels, and label legend samples. The Shape Layer Controls dialog has an Elements tabbed panel with similar controls.
Spatial Display: Render to PDF 9 December 2015
The Render to PDF operation in TNTmips and TNTedit allows you to render the contents of the View window to a PDF file. The operation can render layers in simple groups or complex map layouts, including raster and geometric layers, WMS and ArcIMS layers, map grids, legends and scale bars, and text. Complex line and point symbols, including those created by CartoScripts, can be reproduced faithfully in the PDF file. Georeference information is automatically transferred, producing a Geospatial PDF file that can be used with the analysis tools in Adobe Reader to get coordinate readouts and make measurements. You also have the option to include layer controls in the PDF file so that any individual layer can be turned on or off in Adobe Reader. To use the Render to PDF operation, choose Display / Render to / PDF from the Display Manager.
UPDATED DataTip Technical Guides 3 December 2015
DataTips are provided in TNTgis to show selected attribute information for spatial layers under or near the screen cursor when it is paused in the View window. DataTips can show the cell value from a raster layer, database attributes for elements in geometric objects (vector, CAD, shape, Lidar, and TIN) and database pinmaps, and image thumbnails from a geotagged image database table. When you are displaying geometric data layers, you can choose to have the associated elements automatically highlighted in color when the DataTip is shown.
UPDATED Pin Mapping Technical Guides 19 November 2015
A pinmap layer in TNTgis displays point location information
directly from a database table (or set of related tables) that
include coordinate values. A pinmap layer can utilize a script to
create custom settings for a number of aspects of the pinmap
display, including:
• selection of records by attribute
• X and Y coordinates
• assignment of pin symbol, color, or size by attribute
• custom pie chart or bar graph symbols
• label text, position, and orientation
Spatial Display: Render to Raster 12 November 2015
The Render to Raster operation in TNTgis allows you to render the contents of the View window to a raster in your choice of several formats. The operation can render the visible layers in complex layouts, including raster and geometric layers, WMS and ArcIMS layers, map grids, legends and scale bars, and text labels. You can choose to render the full extents of the data layers or restrict the rendering to the area shown in the View, and set the image size and resolution of the result. When the View is in anaglyph stereo mode, you also have the option to render the displayed group as an anaglyph stereo image. To use the Render to Raster operation, choose Display / Render to / Raster from the Display Manager (Display / Render to Raster in TNTview).
UPDATED for TNTgis 2016: Select Objects Window 4 November 2015
The Select Objects window used in all TNTgis processes has been redesigned to provide a more intuitive interface. The Favorites and Recent lists have been moved to tabbed panels in the upper part of the window (along with the Browse and Catalog Search tabs). A sidebar to the right of the tabbed panels includes a Tree View of the current folder path and a Preview of an object you have highlighted in the list on any of the panels. The controls on any of the tabbed panels can be used to add objects to the Selected list at the bottom of the window.
UPDATED for TNTmips Pro 2016: Export Geometric Tilesets 21 October 2015
The Export Geometric Tileset process in TNTmips Pro converts a styled vector, CAD, or shape object into a geometric web tileset with your choice of the SVG, SVGz, or KML geometric tileset structure. These tiled structures allow you to present styled geometric data on the web for any size area at different levels of detail over a range of zoom levels.
Map Design: Layout Templates 15 October 2015
Layout templates provide a convient way to create maps in a series at the same map scale. Templates designate which map layout content should be the same in all layouts in the series and which content is unique to particular layouts. A layout template is created from an existing map layout using the Save as Template option on the Display menu, which saves the template to a Project File. To create a new layout in the series from the template, choose Display / New / From Template from the Display Manager.

Spatial Display: Placement Tool for Map Layouts 7 October 2015
The Layout Placement tool provides a graphic means of changing the position and attachment settings of all groups in a page layout. When this tool is activated in the View window toolbar, each group is outlined with a placement box, and arrows show the horizontal and vertical attachments for each group. The Group Settings window also opens to show the settings for the active group.
Map Design: Multi-Object Legends for Map Layouts 1 October 2015
Multi-object legends allow you to provide key information about multiple map layers in a single legend in a map layout. The Legend Layer Controls window (opened from the Add Legend icon button in the Display Manager) provides a graphical legend design canvas that lets you add layer legends and text, manually reposition legend entries and text, change the legend sample size and label text, and add horizontal and vertical guidelines to align legends and create multiple columns. Multi-object legends are stored automatically as part of the layout when you save it.
Map Design: Scale Bars 23 September 2015
Scale bars graphically show the correspondence between actual distances and their scaled distances on the map. You can add one or more scale bars to any page layout or display layout using the Add Scale Bar icon button on the Display Manager. Scale bars are automatically drawn to the specified length and scale and can be subdivided into major units with alternating colors and with distance labels and optional tick marks at the unit boundaries. The first major division can be further subdivided into minor divisions. Scale bar settings are specified using the Scale Bar Layer Controls window, which opens automatically when you press the Add Scale Bar icon button. This window is divided into Map Units, Size, and Style control panes and a preview pane that updates automatically to show the result of the current settings.
Text Formatting 16 September 2015
• Text Layer Controls
The Text Layer
Controls window
lets you
enter and edit
formatted text
for text layers
in layouts. The
window includes
a large
canvas area for
entering and
editing text.
You can mix different styles in the same text layer; these style differences are shown in
the Text Layer Controls canvas as well as in the rendered text layer in the layout.
• HTML Formatting of Layout Text
Formatting can be set for text layers in TNTgis layouts in several
ways. In addition to the formatting controls in the Text Layer
Controls window, you can use HTML tags and Cascading Style
Sheet (CSS) Level 2 style properties to define and apply font and
text formatting. TNTgis supports the most common HTML elements
(including tables) and CSS font and text style properties
for text formatting. In addition, you
can use MicroImages extensions to the CSS style properties to
apply custom font styling effects. HTML text can be entered directly in the Text Layer Controls
window, or you can open and link to an external HTML file.
Raster & Image Processing: Lens Correction 9 September 2015
All camera lenses introduce geometric and illumination artifacts into the acquired images. Artifacts such as geometric (barrel) distortion, vignetting, and transverse chromatic aberration may be especially severe in aerial images acquired by small Unmanned Aerial Vehicles (UAVs), many of which use light-weight, low-cost cameras designed for the consumer market. Removing geometric, tonal, and color artifacts is a prerequisite for creating seamless and geometrically correct mosaics of UAV images.
Raster & Image Processing: Convert Raster Data Type 2 September 2015
The Convert Raster Data Type process (Image / Convert Raster / Data Type) allows you to change the data type and/ or rescale one or more continuous-value (grayscale) raster objects. This type of task can also be performed in the Raster Arithmetic and Indices (Scale / Offset operation) and Raster Extract processes, but the Convert Raster Data Type process provides a set of simple controls dedicated specifically to data type conversion and rescaling.
Style Editor: Style By Attribute 27 August 2015
• Style By Attribute: Manual Assignment
The By Attribute style option for elements in geometric objects (vector,
shape, and CAD) associates a separate drawing style with each unique value
in an element database table and field of your choice. This style option
allows elements with different attributes to be visually differentiated in displays.
Legends with attribute labels and style samples can be shown in the
View window sidebar and also added to map layouts for printed products.
The associations between styles and attributes are stored in a style assignment
table in the element database for the relevant element type (element
for CAD or shape objects; point, line, or polygon for vector objects; node,
edge, or triangle for TIN objects). You set up these style-attribute associations
using the Style Assignment Table window in the Display process.
• Style By Attribute: Automatic Style Generation
The controls on the Automatic tabbed panel of the Style Assignment Table window
can be used to automatically create and assign new styles for
points, lines, or polygons. A style is automatically created and assigned for each
unique attribute value in the designated database field. Style names are assigned
based on the name of the associated attribute value. Automatic style generation
can create styles with a variety of colors for point symbols, lines and polygon
borders, and polygon fills. You can also specify a range of sizes for point symbols
or a range of widths for lines and polygon borders. The automatic style generation
option is especially useful when you are creating a new style assignment table
with a new embedded style object, but it can also be used to replace existing
styles. Styles that are automatically generated can be edited subsequently using
the controls on the Manual tabbed panel.
Style Editor: Managing Styles 20 Aug 2015
Styles in TNTgis define how the spatial elements in a geometric object are
drawn on screen and when printing. Appropriately chosen styles improve
the appearance of a map display, differentiate map elements, and can symbolize
the features the elements represent.
Styles for drawing geometric elements are created, named, and stored separately
for different element types: points, lines, polygons, and text (see table
below left). Styles can be plain (simple geometric shapes for points and
solid colors for lines and polygon fills) or use more complex graphics. Points
can be styled using geometric or bitmap symbols, lines can be shown using
patterns with multiple parallel lines or repeating dashes and/or dots, and
polygons can be filled with bitmap or hatch patterns. TNTgis provides built–in
libraries with point symbols, line patterns, and bitmap patterns that you
can use, or you can design your own using symbol and pattern editors, as
described in the Technical Guides entitled Point Symbol Editor,
Line Pattern Editor,
Bitmap Pattern Editor, and Hatch Patterns for Polygon Fills.
Spatial Display: Raster Layer Controls 13 Aug 2015
The Raster Layer Controls window provides controls for varied display settings for all types of raster layers, including grayscale raster objects, color-composites, color separates, and multi-raster layers. The controls are organized in a set of tabbed panels. The Object tabbed panel is shown by default when the window opens. It includes the primary display settings as well as controls for setting up the DataTip for the layer. The Options panel includes layer transparency and scale range controls along with miscellaneous settings. Controls are provided on the Legend panel for choosing and configuring a legend to show in the View sidebar and in layout legends. The Filter panel controls allow you to choose and apply various filters to the display. The Shading panel controls allow you to apply relief shading to a grayscale raster layer, while the settings on the 3D panel apply when the raster layer is used as a drape layer in 3D perspective views.
Style Editor: Creating Styles for Text & Points 5 August 2015
• Creating Styles for Lines
The Point Style controls in the Style Editor allow you to create
and save styles to use in displaying point elements in vector,
CAD, shape, and LIDAR layers as well as nodes in vector and
TIN objects. Points can be styled using predefined geometric
shapes in various colors, using custom vector
graphic symbols that you design or import,
or using bitmap symbols that you create or
import. Point styles can be created and used
when you style points using the All Same, By
Attribute, and By Theme options and can also
be referenced and used in style scripts with
the By Script option.
• Creating Styles for Polygons
The Text Style controls in the Style Editor allow you to set the
font, font style, color, alignment, and size of text displayed in
geospatial views in TNTgis. It allows you to set styles for label
elements in vector, CAD, and sketch objects; dynamic labels;
text layers in print layouts; and legend sample text in print layout
legends.
Style Editor: Creating Styles for Lines & Polygons 30 July 2015
• Creating Styles for Lines
The Style Editor controls for lines allow you to create and save
styles to use in displaying line elements in vector, CAD, TIN,
and shape objects. Line elements can be styled as solid lines of
various colors and widths or using more complex line patterns
that can include multiple parallel solid, dashed, or dotted elements
as well as crossing elements. Line styles can be created
and used when you style lines using the All Same, By Attribute,
and By Theme options and can also be referenced and used in
style scripts with the By Script option.
• Creating Styles for Polygons
The Style Editor controls for polygons allow you to create and
save styles to use in displaying polygon elements in vector, CAD,
TIN, and shape objects. Polygons can be styled with a fill and/
or with a border. A polygon fill can be a solid color (with transparency
between 0 and 100%), a bitmap pattern, or a hatch
pattern. A polygon border can be a solid line with various colors
and widths or use a line pattern. Polygon styles can be created
and used when you style polygons
using the All Same, By Attribute, and
By Theme options and can also be referenced
and used in style scripts with
the By Script option.
Style Editor: New Technical Guides on Line and Hatch Patterns 22 July 2015
• Line Pattern Editor
Use the Line Pattern Editor to create or edit patterns to
use in styling lines and polygon borders in vector, CAD,
or shape objects. A line pattern can be made up of one or
several parallel lines that lie beside or on top of each other.
These pattern elements can be solid, dashed, or made up of
repeating circles (dotted line). You can also add repeating
perpendicular crossing lines to the pattern. Different colors
and dimensions can be set for each of the elements in the
pattern. A variable color option can be set for any line
pattern element instead of a specific color. The variable
color is assigned in the Style Editor window when the
pattern is selected for use. A single line pattern can thus
be used to represent several geometric element types in a
specific application simply by changing the variable color
in the Style Editor.
• Hatch Patterns for Polygon Fills
Hatch patterns are one option for styling polygon fills in vector,
CAD, and shape objects. Hatch patterns are composed of sets of
repeated parallel lines with a regular spacing and a transparent
background. A hatch pattern can be made up of one or more
line sets (hatch elements); each hatch element can have its own
color, angle, spacing, and thickness. The hatch elements can be
simple solid color lines or more complex line patterns created in
the Line Pattern Editor.
Sidebar Features: Vector and Shape Layer Legends 15 July 2015
Legends in the View sidebar for vector and shape layers show style and attribute information for the displayed geospatial elements. For a vector layer, a legend is shown for any element type in the object that has been set to be displayed. A vector layer thus could have legends for points, lines, polygons, and/or nodes. A shape object can only contain one type of geometric element, so a shape layer can have only one element-type legend. Legends can be shown for elements with any styling option: All Same, By Attribute, By Theme, and By Script.
Spatial Display: Raster Layer Controls 8 July 2015
The Raster Layer Controls window provides controls for varied display settings for all types of raster layers, including grayscale raster objects, color-composites, color separates, and multi-raster layers. The controls are organized in a set of tabbed panels. The Object tabbed panel is shown by default when the window opens. It includes the primary display settings as well as controls for setting up the DataTip for the layer. The Options panel includes layer transparency and scale range controls along with miscellaneous settings. Controls are provided on the Legend panel for choosing and configuring a legend to show in the View sidebar and in layout legends. The Filter panel controls allow you to choose and apply various filters to the display. The Shading panel controls allow you to apply relief shading to a grayscale raster layer, while the settings on the 3D panel apply when the raster layer is used as a drape layer in 3D perspective views.
Spatial Display: Select Tool and Marking Elements 1 July 2015
Elements in geometric objects (vector, CAD, shape, and TIN) can be selected or marked in the View window manually or using database queries. You can mark elements in order to see the spatial extents of particular elements or element sets, to examine all of the database attributes associated with them, or to carry out processing or editing operations on the marked elements, among other applications.
TNTmips Newsletter — Reassign Cell Values & Transfer Attributes 24 June 2015
TNTmips 2016 Development Version includes a new process to Reassign Image Cell Values and completely redesigned Set Raster Null Cells and Transfer Attributes processes with greatly expanded capabilities.
Geometric Analysis: Transfer Attributes 17 June 2015
The Transfer Attributes process in TNTmips (Geometric
/ Attributes / Transfer Attributes) has been redesigned and improved. Numerous new features make it easier to use and more powerful.
Download the latest Development Version to try it out.
The Transfer Attributes process lets you automatically transfer attribute tables and records
from elements in a source geometric object to spatially
matching elements in a target object. Vector,
CAD, or shape objects can be used as either source
or target, and attributes can be transferred to the
same or different element type (points, lines, polygons,
or labels) using your choice of matching
criteria. The process can also transfer attributes
from a source raster object with a database (such
as a classification raster) to geometric points.
Raster & Image Processing: Raster Color Conversions 10 June 2015
The Raster Color Conversions process in TNTmips allows you to make single color-composite rasters from sets of separate RGB rasters, to convert color-composites to RGB separates, and to convert image color components to a different color space. The process provides conversions between RGB, Intensity-Hue-Saturation, Brightness-Hue-Saturation, CMY (cyan-magenta-yellow), and CMYK (cyan-magenta-yellow-black).
Database: New Technical Guides on Record Attachment and Field Types 3 June 2015
• Record Attachment Types
Elements in geometric objects (vector, CAD, shape) and cell values
in raster objects can have database tables with records that
associate attributes with particular elements or cell values. The
records in a database table can be associated to the elements in
one of two ways. Records can be directly attached to the elements,
or related to records in another table using matching values
in primary key / foreign key fields. A sequence of tables can be
related by sets of common values, and if one of these tables is
directly attached to the elements, then records in the related tables
are also indirectly associated with the elements.
• Field Types in Tables
Database tables in TNTgis can include fields with a variety of
data types. The data type for each field in a table is shown in
the Type column in the Table Properties window. This Technical Guide describes the properties and limits of the various field data types.
Database: Computed Numeric and Text Fields 28 May 2015
A computed field is a field in a database table that does not contain static data but instead uses an expression to compute a value from values stored in other fields in the same table or a related table. The computed field expression is evaluated separately for each record in the table, so the same expression can return different values in different records. There are two types of computed fields: computed numeric and computed text.
Updated Technical Guides on Raster Contrast Enhancement 20 May 2015
• Image Contrast Enhancement
Images that you display may have poor inherent brightness and
contrast. The Display process in TNTgis can automatically
adjust the brightness and contrast of images, but you can also
design and save specific contrast enhancements using the Raster
Contrast Enhancement window.
• Contrast Enhancement for Local Areas
Aerial and satellite images may include very bright areas (such
as clouds, snow) and very dark areas (such as water) in addition
to your areas of interest. If these bright or dark areas are
extensive, their influence on the brightness histograms for the
entire image may make it difficult to design appropriate contrast
and color for your areas of interest. The Raster Contrast
Enhancement window in TNTgis allows you to design contrast
enhancement using
the image characteristics
of any portion of
the displayed image.
• Enhance Color Composite Images
When you display a 24-bit composite image in
any TNTgis view, you can adjust the contrast and brightness of
the image by choosing an automatic contrast method, or you can
design and save your own custom contrast settings for each color
component.
• Hyperbolic Tangent Contrast Enhancement
The Hyperbolic Tangent contrast enhancement
method uses the hyperbolic
tangent trigonmetric function to produce
a nonlinear translation of raster values to
display values to improve image contrast.
Updated Technical Guides on Map Grids 13 May 2015
• Map Grids
You can add one or more map grids to a geospatial group to provide a visual
geographic reference to the presentation.
• Map Grid Label Placement and Orientation
The Labels tabbed panel on the Map Grid Layer Controls window
provides a high degree of control on the placement and
orientation of map grid labels.
• Map Grid Label Formats
The Labels tabbed panel on the Map Grid Layer Controls window lets you
control the placement, orientation, coordinate format, and font style of
map grid labels.
Updated Technical Guides for Groups in Display 6 May 2015
• Display Layers, Elements and Groups by Scale
The Display process in TNTgis lets you control which layers,
geometric elements, and display groups are visible at different
map scales. These settings allow you to automatically display
low-resolution, generalized, or more prominent features when
zoomed out and present more detailed, higher-resolution data
when zoomed in.
• Group Settings for Standalone Groups
The Group Settings window provides controls that determine
how the set of layers in a geospatial group are
displayed. The main options are setting the coordinate reference
system (CRS) used for displaying the layers and limiting
the map extents over which the layers are displayed.
• Settings for Groups in Layouts
For spatial groups in a layout, you can set coordinate
reference system and group clipping options, determine the placement
of the group on the page for print layouts, create
backgrounds and borders, and set scale range limits for the group.
Updated Technical Guides for Display 29 April 2015
• Placement Tool for Map Layouts
The Layout Placement tool provides a graphic means of changing
the position and attachment settings of all groups in a page layout.
• Pan and Zoom with the View Position Tool
The View Position tool is the default tool in View windows in the TNTgis products. Using this tool you can left-click and drag to pan
the view contents or quickly recenter on any location in the view. While using this tool you can also zoom the view in several ways:
using the zoom icon buttons on the View window toolbar, the mouse scroll wheel, or keyboard shortcuts (hotkeys).
Set Raster Null Cells 23 April 2015
Raster objects in TNTgis can have null cells, the term used
to indicate that the specified cells do not represent valid data
and should be ignored during display or processing. Null cells
can be identified in one of two ways:
• a single null value: all cells with the designated value are
treated as null;
• a null mask: a binary raster subobject that has value 0 for
null cells and value 1 for valid (non-null) cells.
Raster & Image Processing: Reassign Image Cell Values 16 April 2015
The Reassign Image Cell Values process (Image / Filter / Reassign Cell Values) transforms individual cell values or ranges of cell values in an input raster object to different values in an output raster object of the same dimensions. The input raster can be any single-value integer or floating-point data type, and the output raster can have a different data type than the input. Multiple input rasters with the same data type can be processed together using the same reassignment settings.
View Window Technical Guides 8 April 2015
View windows for the 2D display of geospatial data are an
integral part of many processes in the TNTgis software products.
The following Technical Guides show the main components of the View window and how to show the current GPS position in your View or play back tracks from a GPS log file.
• View Window
• Track GPS Position
Automated Geospatial Processing with TNTscript 1 April 2015
TNTscript allows powerful and efficient geospatial processes to be integrated into complex automated work�flows and custom programs. Leverage the power of the TNTgis SML scripting language across your enterprise network or the internet to automatically create geospatial products as new data arrives or by user requests.
More about TNTscript
Rational Polynomial Orthorectification Technical Guides 27 March 2015
The Image Resampling process in TNTmips allows you to orthorectify an image that has rational polynomial coefficients (RPCs) that define an empirical orthorectification model. You can rectify an ortho-ready satellite image that has an RPC model supplied by the vendor and stored as coefficients in an auxiliary file. You can also use the Georeference process in TNTmips to compute an RPC model for any aerial or satellite image using 3D control points and an elevation raster.
Updated Technical Guides:
• Rational Polynomial Orthorectification
• Georeferencing Ortho-Ready Images for Rational Polynomial Orthorectification
• Orthorectification Results for QuickBird
• Compute Rational Polynomial Model for Orthorectification
Raster & Image Processing: Reproject and Rectify Images 12 March 2015
The Automatic Resampling process in TNTmips (Image / Resample
and Reproject / Automatic) is used to change the geometry of a
raster object or objects using stored georeference information. Use
this process to:
• reproject an image with control point georeference so that its
cell grid aligns with its coordinate reference system
• reproject an image to align to a different coordinate reference
system
• rectify internal distortions due to the imaging system (lens
effects and tilt distortion due to off-nadir imaging)
• orthorectify images using a rational polynomial model to
remove distortions due to varying terrain elevations
New Sidebar Technical Guides 26 February 2015
• View Window Sidebar
• Sidebar Legends
• Legend Samples for CartoScript Styles
• Legend Types for Raster Layers
• Vector Layer Legends
• Easily Vary Transparency for Any Layer
• Locator Manages Zoom and Position
• Save Locations with Places Panel
• Set View Position with Places Panel
• Sidebar Zoom Panel
The View window sidebar can show up to six optional panels that provide information about the data in the View and let you modify the display.
New and updated Technical Guides have been prepared to explain the use of the sidebar Legend, Layer Transparency, Magnifier, Locator, Places, and Zoom panels.
Introduction to the Display Interface 19 February 2015
The Introduction to the Display Interface tutorial is an overview of the user interface for the display process that is common to TNTmips, TNTedit, and TNTview. It introduces basic concepts, controls, and operating procedures that you can use while displaying any type of geospatial data. For new users, this is the next tutorial to read after Getting Started with TNTmips, TNTedit, and TNTview. The companion tutorial Displaying Geospatial Data and will be rewritten to cover techniques specific to particular data layer and display types.
System: Using the Contact Support Window 4 February 2015
The Contact Support feature integrated into each component of the TNTgis software family is the most efficient way to obtain free technical assistance from MicroImages. You can use it to request assistance in using your TNTgis software, to report a software error you encountered, or to request a new software feature. The Contact Support window provides an easy way to collect and send to MicroImages all of the information that our software support engineers need to help you quickly and efficiently. It makes it easy to transmit sample data, screen shots, screen movies, process settings, session logs, and other materials related to your request.
Import: Crop and/or Sample Images During Import 21 January 2015
TNTmips Pro allows you to import and work with raster images of any size. However, you may only be interested in importing a portion of a large image. The Import process provides a visual interface that allows you to designate the area of the image to extract and also provides the option to downsample the extracted area to a larger cell size. This interface also provides settings to fit the output to the raster size restrictions of TNTmips Basic or TNTmips Free.
Getting Started with TNTmips, TNTedit, and TNTview 21 January 2015
The Getting Started with TNTmips, TNTedit, and TNTview tutorial introduces the TNTgis software including basic interface, vocabulary, data formats, georeference information, and more.
Release of TNTgis 2015 14 January 2015
The 2015 Release Version of the TNTgis software family (TNTmips, TNTedit, and TNTview) is now available.
This release incorporates over 350 new features, including support for Mac OS X 10.10 Yosemite, the capability to generate a Rational Polynomial Coefficient orthorectification model for an image from 3D control points, many new vegetation indices, and a number of updated spatial statistics processes.
Download the new Release Version today!
Database: Table Properties Window 7 January 2015
The Table Properties window lets you view, create, and modify the properties of a database table, its component fields, and their relationships to fields in other tables.